Contents
Tags

Your GPU Is at 5% While Generating. That's Correct
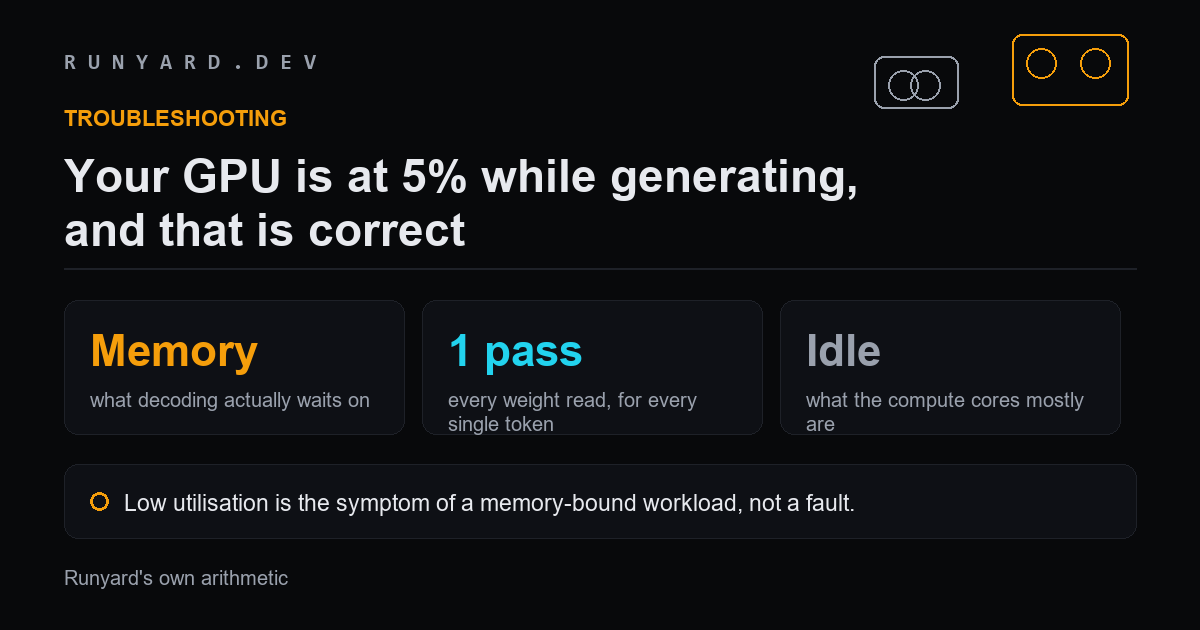
You open nvidia-smi while your model is generating and the GPU reads 5%. Everything works, the tokens come out, but it looks like the card is idle. Something must be misconfigured.
Nothing is misconfigured. That number is what a correctly working local LLM looks like.
Why the cores are idle
To produce one token, the model reads every one of its active weights exactly once. For a 14B model at Q4_K_M that is about 8 GB of data moved for a single token, and comparatively little arithmetic done with it.
So the bottleneck is memory bandwidth, not compute. The cores do their work quickly and then wait for the next chunk of weights to arrive. Utilisation measures how busy the cores are, and they are mostly waiting.
This is why we rank hardware on bandwidth rather than TFLOPs, and why a card with huge compute and modest bandwidth disappoints on local models while looking excellent on paper.
When the GPU does go busy
- ▸Prompt processing. Reading a long prompt is compute-heavy and parallel, so utilisation spikes at the start and drops once generation begins.
- ▸Batched serving. Several requests decode together, reading the weights once for the whole batch, which raises arithmetic per byte moved.
- ▸Image generation and training. Both are genuinely compute-bound and will peg the card.
- ▸Very small models. A 1B model moves so little data that other costs start to dominate.
What this means for buying and tuning
It reframes most of the advice you will read. A faster GPU core does not make token generation proportionally faster; more memory bandwidth does. Overclocking the core is largely wasted on this workload, while memory clocks matter.
It is also why a power limit costs less than you expect. Capping a card at around 70% of its board power typically costs only a few percent of generation speed, because the part you are limiting was not the bottleneck.
The one time low utilisation IS a problem
If utilisation is low and tokens per second is far below what your bandwidth allows, check whether layers have spilled to system RAM. That is a real fault, and it looks similar from the outside. The tell is the throughput, not the utilisation figure.
How to read nvidia-smi properly
The headline utilisation number is the least useful figure on the screen for this workload. What you actually want is memory throughput and clocks.
# The default view - utilisation here is misleading for LLMs
nvidia-smi

# What to watch instead, once a second
nvidia-smi --query-gpu=utilization.gpu,utilization.memory,\
clocks.sm,clocks.mem,power.draw,memory.used \
  --format=csv -l 1

# utilization.memory near 100% while utilization.gpu is low
# is exactly what a healthy memory-bound decode looks like
If memory utilisation is high and core utilisation is low, everything is working. If both are low and generation is slow, that is when to investigate.
Why this is not a fixable inefficiency
It is tempting to treat idle cores as waste to be reclaimed. They are not. The ratio of arithmetic to data movement in single-stream decoding is fixed by the maths — one pass over the weights per token, with a small number of operations per weight. No driver, setting or runtime changes that ratio.
The only ways to raise utilisation are to give the cores more work per byte moved: batch several requests together, process a long prompt, or run a genuinely compute-bound workload like image generation or training.
When low utilisation IS hiding a problem
Utilisation alone will not tell you, but throughput will. Work out what your card should give you — bandwidth divided by the size of the weights, times roughly 0.8 — and compare it to what you are seeing.
- ▸Getting close to the estimate: everything is fine, however idle the cores look.
- ▸Getting a fraction of it: layers have probably spilled to system RAM. Check whether the whole model is resident.
- ▸Getting single digits on a card that should do fifty: almost certainly CPU offload, not a utilisation problem.
- ▸Utilisation low AND memory utilisation low: something else is wrong — the model may not be on the GPU at all.
Common questions
Should I overclock my GPU for local AI?
Memory clocks, maybe. Core clocks, largely pointless. The core is not the constraint, so overclocking it spends power and heat on the part that was already waiting.
Will a power limit hurt generation speed?
Much less than you would expect. Capping a card at around 70% of board power typically costs a few percent of tokens per second, because you are limiting compute that was idle. It is one of the best trades available for a machine that runs models often.
Why is my GPU busy during prompt processing?
Prompt processing reads many tokens at once and is genuinely parallel, so it is compute-bound. You will see utilisation spike at the start of a long prompt and drop as soon as generation begins. That transition is the clearest demonstration of the difference.
Does this apply to Apple Silicon too?
Yes. The same relationship holds — generation speed tracks memory bandwidth, which is why the chip tier matters more than the core count for local models on a Mac.
What your card's bandwidth should be giving you.
Estimate your tokens per second →Tools
Find AI models that fit your exact hardware. Enter your specs and get a ranked list instantly.
Newsletter