Contents
Tags

CUDA Out of Memory: The Five Causes, in Order
CUDA out of memory is the most common error in local AI and it has a short list of causes. Working through them in the right order saves a lot of time.
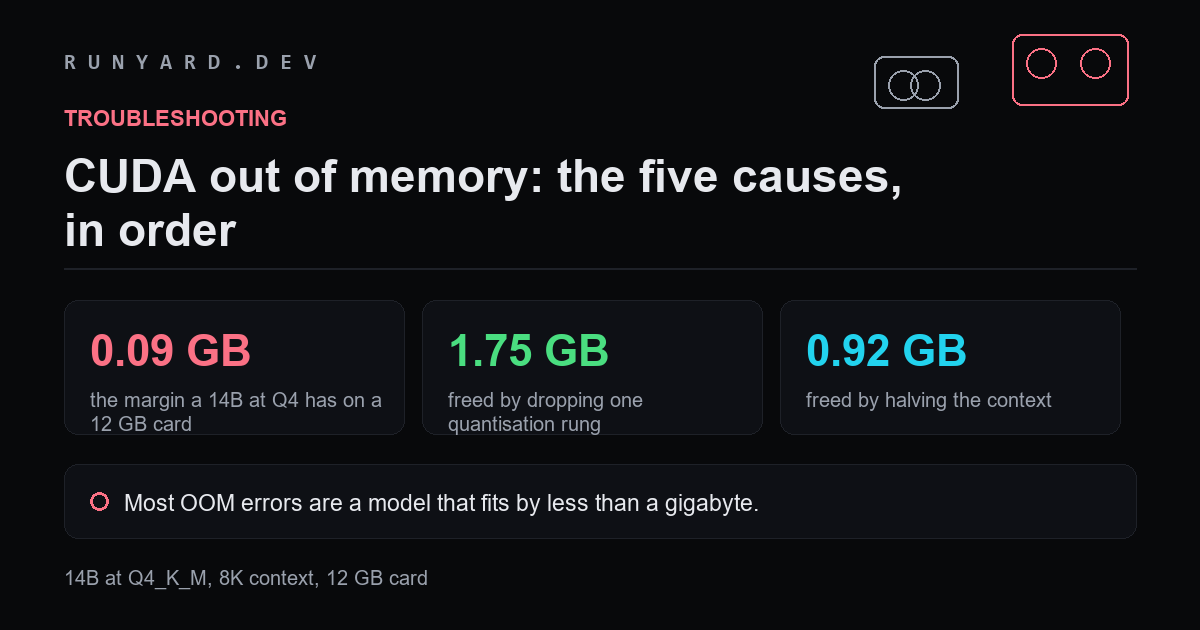
Start with the number that explains most cases. A 14B model at Q4_K_M with an 8K context needs about 10.71 GB. A 12 GB card gives you about 10.8 GB usable. It fits — by 0.09 GB.
A margin that thin is why the same configuration loads one day and fails the next. Nothing changed about the model. Something else took 100 MB.
1. The weights never fit
If it fails immediately on load, the model is simply too big. No amount of tuning fixes this; you need a smaller model or a lower quantisation.
2. The KV cache grew
If it loaded fine and died an hour into a conversation, this is it. The cache grows with every token and does not shrink until you clear the chat. Starting a new conversation releases it immediately.
3. Something else is holding VRAM
Browsers, video calls, the desktop compositor, and an earlier model you forgot to unload. Check with nvidia-smi before blaming the model.
4. Fragmentation
Long-running processes that repeatedly allocate and free can leave memory that is technically available but not contiguous. Restarting the runtime fixes it, which is why 'have you tried restarting' is annoyingly effective.
5. The runtime is reserving more than you think
Serving frameworks pre-allocate a pool. vLLM's gpu-memory-utilization defaults high on purpose, and if anything else wants memory afterwards there is none left.
What each fix actually frees
On that 14B at Q4_K_M on a 12 GB card:
- ▸Drop to Q3_K_M — frees about 1.75 GB. The biggest single lever.
- ▸Halve the context from 8K to 4K — frees about 0.92 GB.
- ▸Both together — takes you from 10.71 GB to 8.04 GB, a comfortable margin.
- ▸Flash attention — smaller, but free, and grows with context.
- ▸Quantise the KV cache to 8-bit — roughly halves the cache term.
Notice the ordering. Quantisation frees nearly twice what halving your context does, and costs less in practice than losing half your window.
Every figure here is computed the same way the calculators do it: weights are parameters times bits-per-weight divided by eight, plus a KV-cache term for your context, plus about a gigabyte of runtime overhead. Usable memory is roughly 90% of nameplate on a discrete card.
Working out how close you actually are
Before changing anything, it is worth knowing whether you are missing by 100 MB or by 5 GB, because those need completely different responses.
nvidia-smi --query-gpu=memory.total,memory.used,memory.free \
  --format=csv

# then, with the model loaded and a long conversation running,
# watch it move:
nvidia-smi --query-gpu=memory.used --format=csv -l 2
If free memory sits at a few hundred megabytes during normal use, you are in the fits-by-a-hair case and almost anything will tip it. If you are several gigabytes short at load, no amount of context tuning will help and you need a smaller model or a lower quantisation.
Fixes ranked by what they cost you
All of these free memory. They differ in what you give up, which is the part most guides leave out:
- ▸Flash attention — frees a little, costs nothing at all. Always first.
- ▸Shorter context — frees a moderate amount, costs the ability to hold long documents. Reversible per session.
- ▸KV cache quantisation to 8-bit — roughly halves the cache term for a small quality cost on long contexts.
- ▸One quantisation rung down — frees the most of any single change, at a modest and well-documented quality cost above 4 bits.
- ▸Partial CPU offload — frees as much as you like, and costs most of your speed. Genuinely the last resort, despite being the most commonly suggested.
Preventing it rather than fixing it
The durable fix is to stop running at the edge. Pick a configuration with 1–2 GB of headroom rather than one that fits exactly, and the intermittent crashes disappear along with the tuning.
That usually means choosing the quantisation one rung below what technically fits, and setting a context you will actually use rather than the largest the model supports.
Common questions
Why does restarting fix it temporarily?
Fragmentation and leftover allocations. A long-running process that repeatedly allocates and frees can end up with memory that is free but not contiguous, and a restart compacts it.
Does closing Chrome really help?
Often by more than people expect. A browser with hardware acceleration and several tabs can hold a gigabyte or more of VRAM, and on a card that fits a model by 100 MB that is decisive.
Is it the model or the cache?
Timing tells you. Failing at load is the weights. Failing after a while is almost always the cache growing with the conversation.
Can I use system RAM as overflow automatically?
Some drivers will do this rather than failing outright, which is worse than an error — you get a model that works at a crawl instead of a clear failure. If generation suddenly became very slow instead of crashing, this is likely what happened.
Put your own model and card in and see which fix clears the error.
Open the OOM fix assistant →Tools
Find AI models that fit your exact hardware. Enter your specs and get a ranked list instantly.
Newsletter