Contents
Tags

Cost Per Task Beats Cost Per Token. Here's How to Actually Measure It
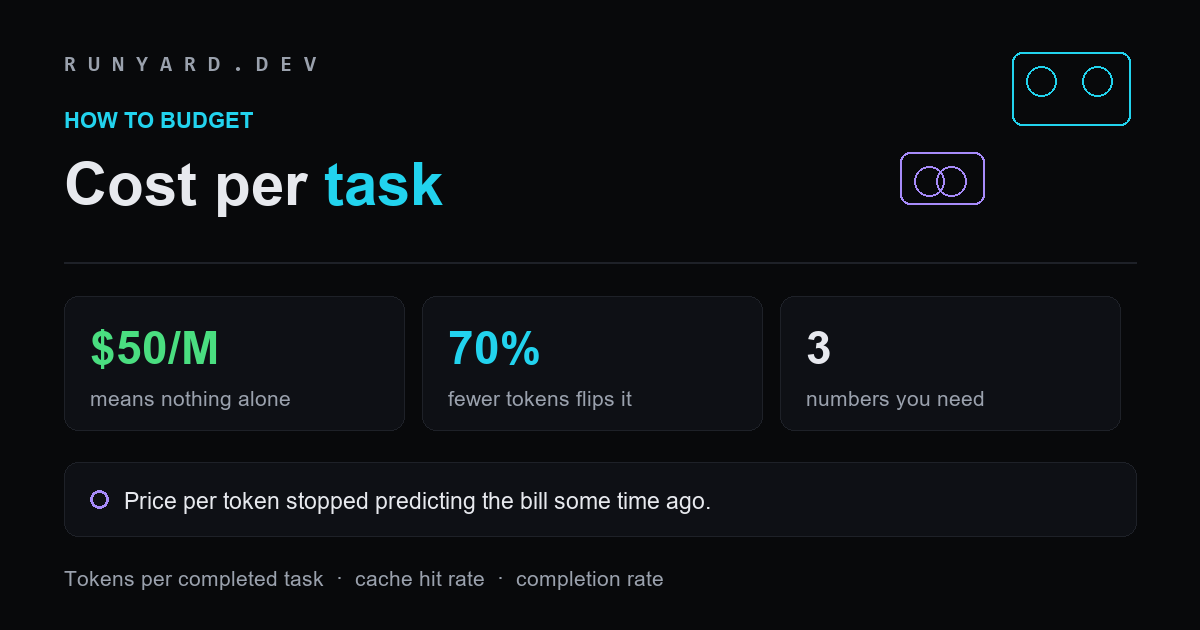
Every model page leads with price per million tokens, and it has quietly stopped predicting what you will pay. A model at $50 per million output can genuinely cost less per finished job than one at $20, if it uses far fewer tokens and fails less often. OpenAI's own launch materials for GPT-6 Astra plot cost per task rather than price per token, and Greg Brockman said the quiet part out loud: pricing by tokens no longer makes sense. Here is how to actually compute the number that matters.
Why price per token stopped working
Three things broke it, all recent.
- ▸<strong>Reasoning tokens.</strong> Models that think before answering bill that thinking as output. Two models at the same output price can differ several-fold in how many reasoning tokens they spend on the same question, and the verbose one costs multiples more.
- ▸<strong>Agent loops.</strong> When a task takes twenty turns rather than one, the conversation prefix is re-sent every turn. Total cost becomes a function of turn count and cache behaviour, not of a single request's size.
- ▸<strong>Failure and retry.</strong> A run that fails at step eighteen and restarts has cost you eighteen steps for nothing. Completion rate is a cost variable, and it appears on no pricing page.
- ▸<strong>Threshold pricing.</strong> GPT-6 Astra reprices entire requests above 272,000 input tokens. The headline rate is simply not the rate you pay on long-context work.
The three numbers you actually need
Cost per completed task is computable from three measurements, all of which you can gather from your own logs in an afternoon.
- ▸<strong>Tokens per completed task</strong> — input and output separately, summed across every turn the task took, counting only runs that succeeded.
- ▸<strong>Cache hit rate</strong> — the fraction of input tokens served from cache, which can be the difference between $10 and $0.25 per million depending on the model.
- ▸<strong>Completion rate</strong> — the fraction of attempts that finish correctly, because failed attempts are paid for in full.
cost_per_attempt = (fresh_in x in_rate)
                 + (cached_in x cache_rate)
                 + (out x out_rate)

cost_per_completed_task = cost_per_attempt / completion_rate

A 60% completion rate multiplies your real cost by 1.67x.
A 95% completion rate multiplies it by 1.05x.
A worked example where the expensive model wins
Take two models. Model A costs $10 input and $50 output per million. Model B costs $4 and $20 — less than half. On price per token, B wins decisively.
Now add measurements. On your task, A uses 40,000 output tokens and completes 90% of the time. B is more verbose, using 120,000 output tokens, and completes 80% of the time. Assume both consume 50,000 fresh input tokens.
Model A ($10 / $50)
  input   50,000 x $10/1M  = $0.50
  output  40,000 x $50/1M  = $2.00
  attempt                  = $2.50
  per completed task / 0.90 = $2.78

Model B ($4 / $20)
  input   50,000 x $4/1M   = $0.20
  output 120,000 x $20/1M  = $2.40
  attempt                  = $2.60
  per completed task / 0.80 = $3.25

B is 60% cheaper per token and 17% more expensive per task.
These are illustrative numbers rather than measured ones, and that is precisely the point: the ranking flipped on token efficiency and completion rate, neither of which appears on a pricing page. This is not a hypothetical effect either. Artificial Analysis measured GPT-6 Astra as roughly 70% more token-efficient than its predecessor on coding tasks while its price rose 2.5×, which is close to cost-neutral on that workload despite a large headline increase.
Why vendors are pushing this reframing now
It is worth being clear-eyed about the incentive. OpenAI plotted cost per task rather than price per token throughout Astra's launch materials, and did so while raising the headline price 2.5× over its predecessor. A metric that makes a price rise look like a saving is a convenient metric to promote.
That does not make it wrong. Token efficiency is genuinely measurable, and a 70% reduction in tokens per coding task against a 2.5× price rise really does land close to cost-neutral. Both things are true at once: the reframing is substantively correct, and it is being promoted by the party it flatters.
The defence is to compute it yourself rather than accept a vendor's chart. Cost per task is only a better metric if it is measured on your workload; measured on someone else's benchmark suite it is just a differently shaped marketing claim.
Where cost per token still wins as a metric
It would be overcorrecting to abandon price per token entirely. It remains the right metric in two cases.
- ▸<strong>Single-turn, bounded tasks.</strong> Classification, extraction, translation, short summarisation. Output length is predictable, completion is near-certain, and price per token is close to price per task by definition.
- ▸<strong>Price gaps of one or two orders of magnitude.</strong> When one option is 143 times cheaper on input, as GLM-5.3-Flash is against Astra, no plausible efficiency or completion difference closes that. Token efficiency reorders models within a tier; it does not bridge tiers.
The reframing matters most in the middle: comparing models within roughly 3× of each other on price, on multi-turn agentic work. That is exactly where most real decisions sit, and exactly where price per token misleads.
How to measure it without building anything
You do not need an evaluation harness. You need twenty representative tasks and a spreadsheet.
- ▸Pick twenty tasks from real work, weighted the way your actual load is weighted.
- ▸Run each on both candidate models, logging input tokens, cached tokens, output tokens and whether the result was acceptable. Most APIs return the token counts in the response.
- ▸Compute cost per attempt with the formula above, then divide by your completion rate.
- ▸Repeat each task at least three times. Completion rate estimated from a single run is noise, and variance between runs is itself useful information.
- ▸Re-run when you change effort level, harness or prompt — all three move token counts more than people expect.
The whole exercise costs a few dollars of tokens and an afternoon, and it replaces an argument about pricing pages with a number.
What to do with the number once you have it
A cost-per-task figure is only useful if it changes a decision. Three decisions it should inform directly.
- ▸<strong>Routing.</strong> If two models are within 20% of each other on cost per task, pick on reliability and latency rather than price — the difference is inside your measurement error. If one is 3× cheaper per task, route the matching work there and stop debating.
- ▸<strong>Effort tuning.</strong> Reasoning effort is a direct multiplier on output tokens and therefore on cost per task. Measure at two effort levels before you measure two models; the cheaper lever is usually the one nobody pulled.
- ▸<strong>Prompt and harness changes.</strong> An instruction to make targeted edits rather than rewrite whole files, or a harness that carries state properly between turns, can move token counts more than switching model does. Both are free.
The habit worth building is recomputing cost per task whenever any of those change, rather than treating it as a one-off procurement exercise. Token counts drift as prompts evolve, and a routing decision made six months ago on measurements that no longer hold is a common and invisible source of overspend.
The version of this that saves the most money
Once you are measuring cost per task, an uncomfortable pattern usually appears: a large share of tasks complete perfectly well on a much cheaper model, and the expensive model is being paid for on work that never needed it.
That is the real payoff of the metric. Not choosing between two frontier models, but discovering that a third of your volume — boilerplate, renaming across files, format conversion, first-draft tests, summarising diffs, codebase questions — completes at near-100% on an open-weight model running on hardware you already own, at zero cost per token and with no rate limit.
A 32B-class model fits a 24 GB card at Q4_K_M, a 14B fits 16 GB, an 8B runs on 8 GB. Our <a href="/models">Model Explorer</a> ranks what fits your specific machine. Measure cost per task across all three tiers — local, mid-tier API, frontier API — and the routing decision usually makes itself.
Tell it your GPU, RAM and backend, and it ranks every open-weight model that actually fits your machine.
Open the Model Explorer → →Tools
Find AI models that fit your exact hardware. Enter your specs and get a ranked list instantly.
Newsletter